Partnerships

You have data.
We make it understood.

Malaysia's data storytelling studio.

Newsgraphy works with media organisations, government agencies, corporations, and institutions to turn complex information into clear, credible, and compelling visual content — built on editorial rigour, not just design.

When your audience sees content produced by Newsgraphy, they don't just see numbers. They understand what those numbers mean.

10+
Major partners
3
Languages: Malay, Chinese & English
4
Core service offerings
Previously engaged by the following organisations, including:

Not a design agency.
A data storytelling studio.

Editorial Backbone

Every project is governed by the same editorial standards applied to our independent journalism — verified sources, methodological transparency, and a clear separation between creative execution and factual accuracy. You are not just buying design. You are lending your audience our credibility.

Local Intelligence

We know Malaysia's data landscape — the DOSM datasets, government portals, electoral boundaries, and the institutional context behind the numbers. International studios have to learn Malaysia before they can begin. We already know it.

Trilingual by Design

We produce accurate, verified content in Malay, English or Chinese — from the same team, at the same quality. For organisations whose audience spans Malaysia's language communities, this is a capability no international studio can match.

Organisations we serve

Media Organisations

News publishers that need data coverage at scale — from breaking election graphics to in-depth investigative visualisations.

Government Agencies

Public bodies communicating policy, budgets, and public data to citizens in a form they can actually engage with.

Corporations

Organisations with ESG reporting obligations, investor communications, or internal data that deserves a wider audience.

Research Institutions

Universities and think tanks whose research findings need to reach policymakers and the public, not just peer reviewers.

NGOs, CSOs & Foundations

Impact-driven organisations that need to demonstrate results and communicate evidence to donors, partners, and the public.

Higher Education Institutions

Faculties and student bodies building data literacy — from workshop curricula to student journalism projects.

What you receive when you work with us

Interactive

Interactive Data Storytelling

For organisations that need their audience to do more than read — they need them to engage. We build interactive microsites and narrative-driven digital experiences that guide your audience through complex data, step by step. Each piece is designed around your specific message, your audience's level of familiarity, and the action you want them to take.

Best for: Government agencies, media organisations, public campaigns, policy communications.

Design

Infographic Design

For organisations that need to communicate a lot, clearly, in a format people will actually share. We transform your data, findings, and reports into clean, accurate, and visually compelling infographics — designed for both digital distribution and print. Every infographic is built on verified data and produced to your brand guidelines.

Best for: Corporations, NGOs, research institutions, media publishers.

Reports

Report Visualisation

For organisations whose reports are read by fewer people than they deserve. We take your existing reports, decks, and research documents and redesign them for clarity and impact — so your key findings reach decision-makers, stakeholders, and the public in a form they can act on, not just file away.

Best for: Think tanks, government bodies, consultancies, academic institutions.

Training

Data Workshops

For organisations that want to build the capability in-house, not just outsource it. We design and facilitate customised data storytelling workshops for your team — combining practical tool training with real data exercises. Participants leave with skills they can apply immediately, and your organisation gains a lasting internal capability.

Best for: Media organisations, universities, corporate communications teams, public sector agencies.

Book a free chat

No commitment. We'll see if there's a fit.

Work we have done

01

Daily Express Malaysia & Overseas Chinese Daily News

Sabah Election 2025 —
End-to-End Data Coverage

Election data suite Bilingual graphics Full-cycle coverage

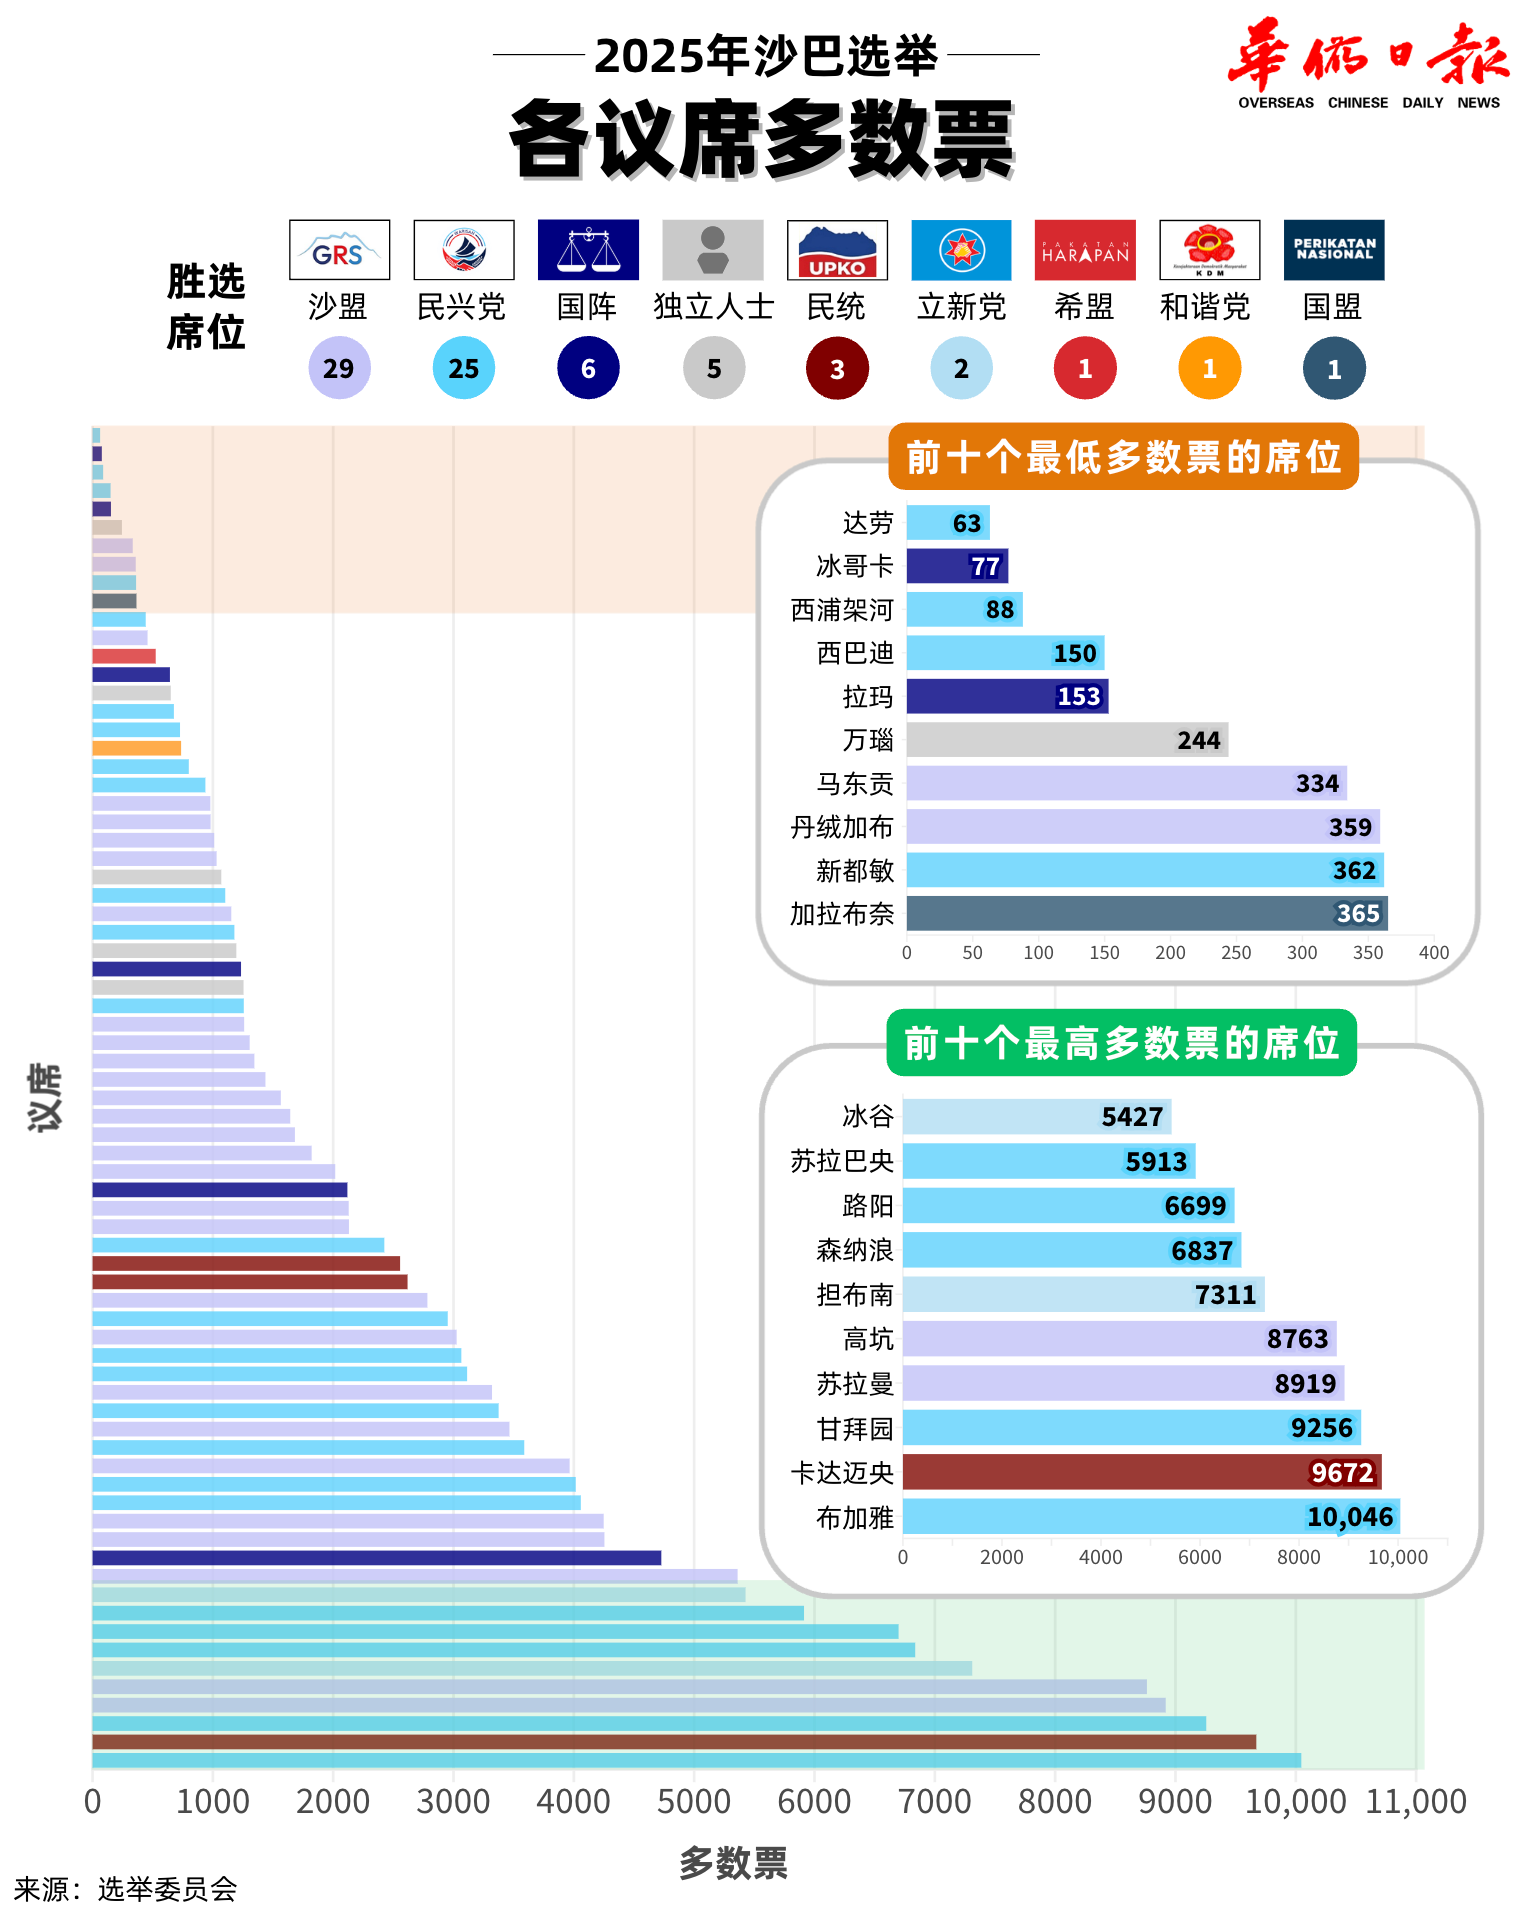
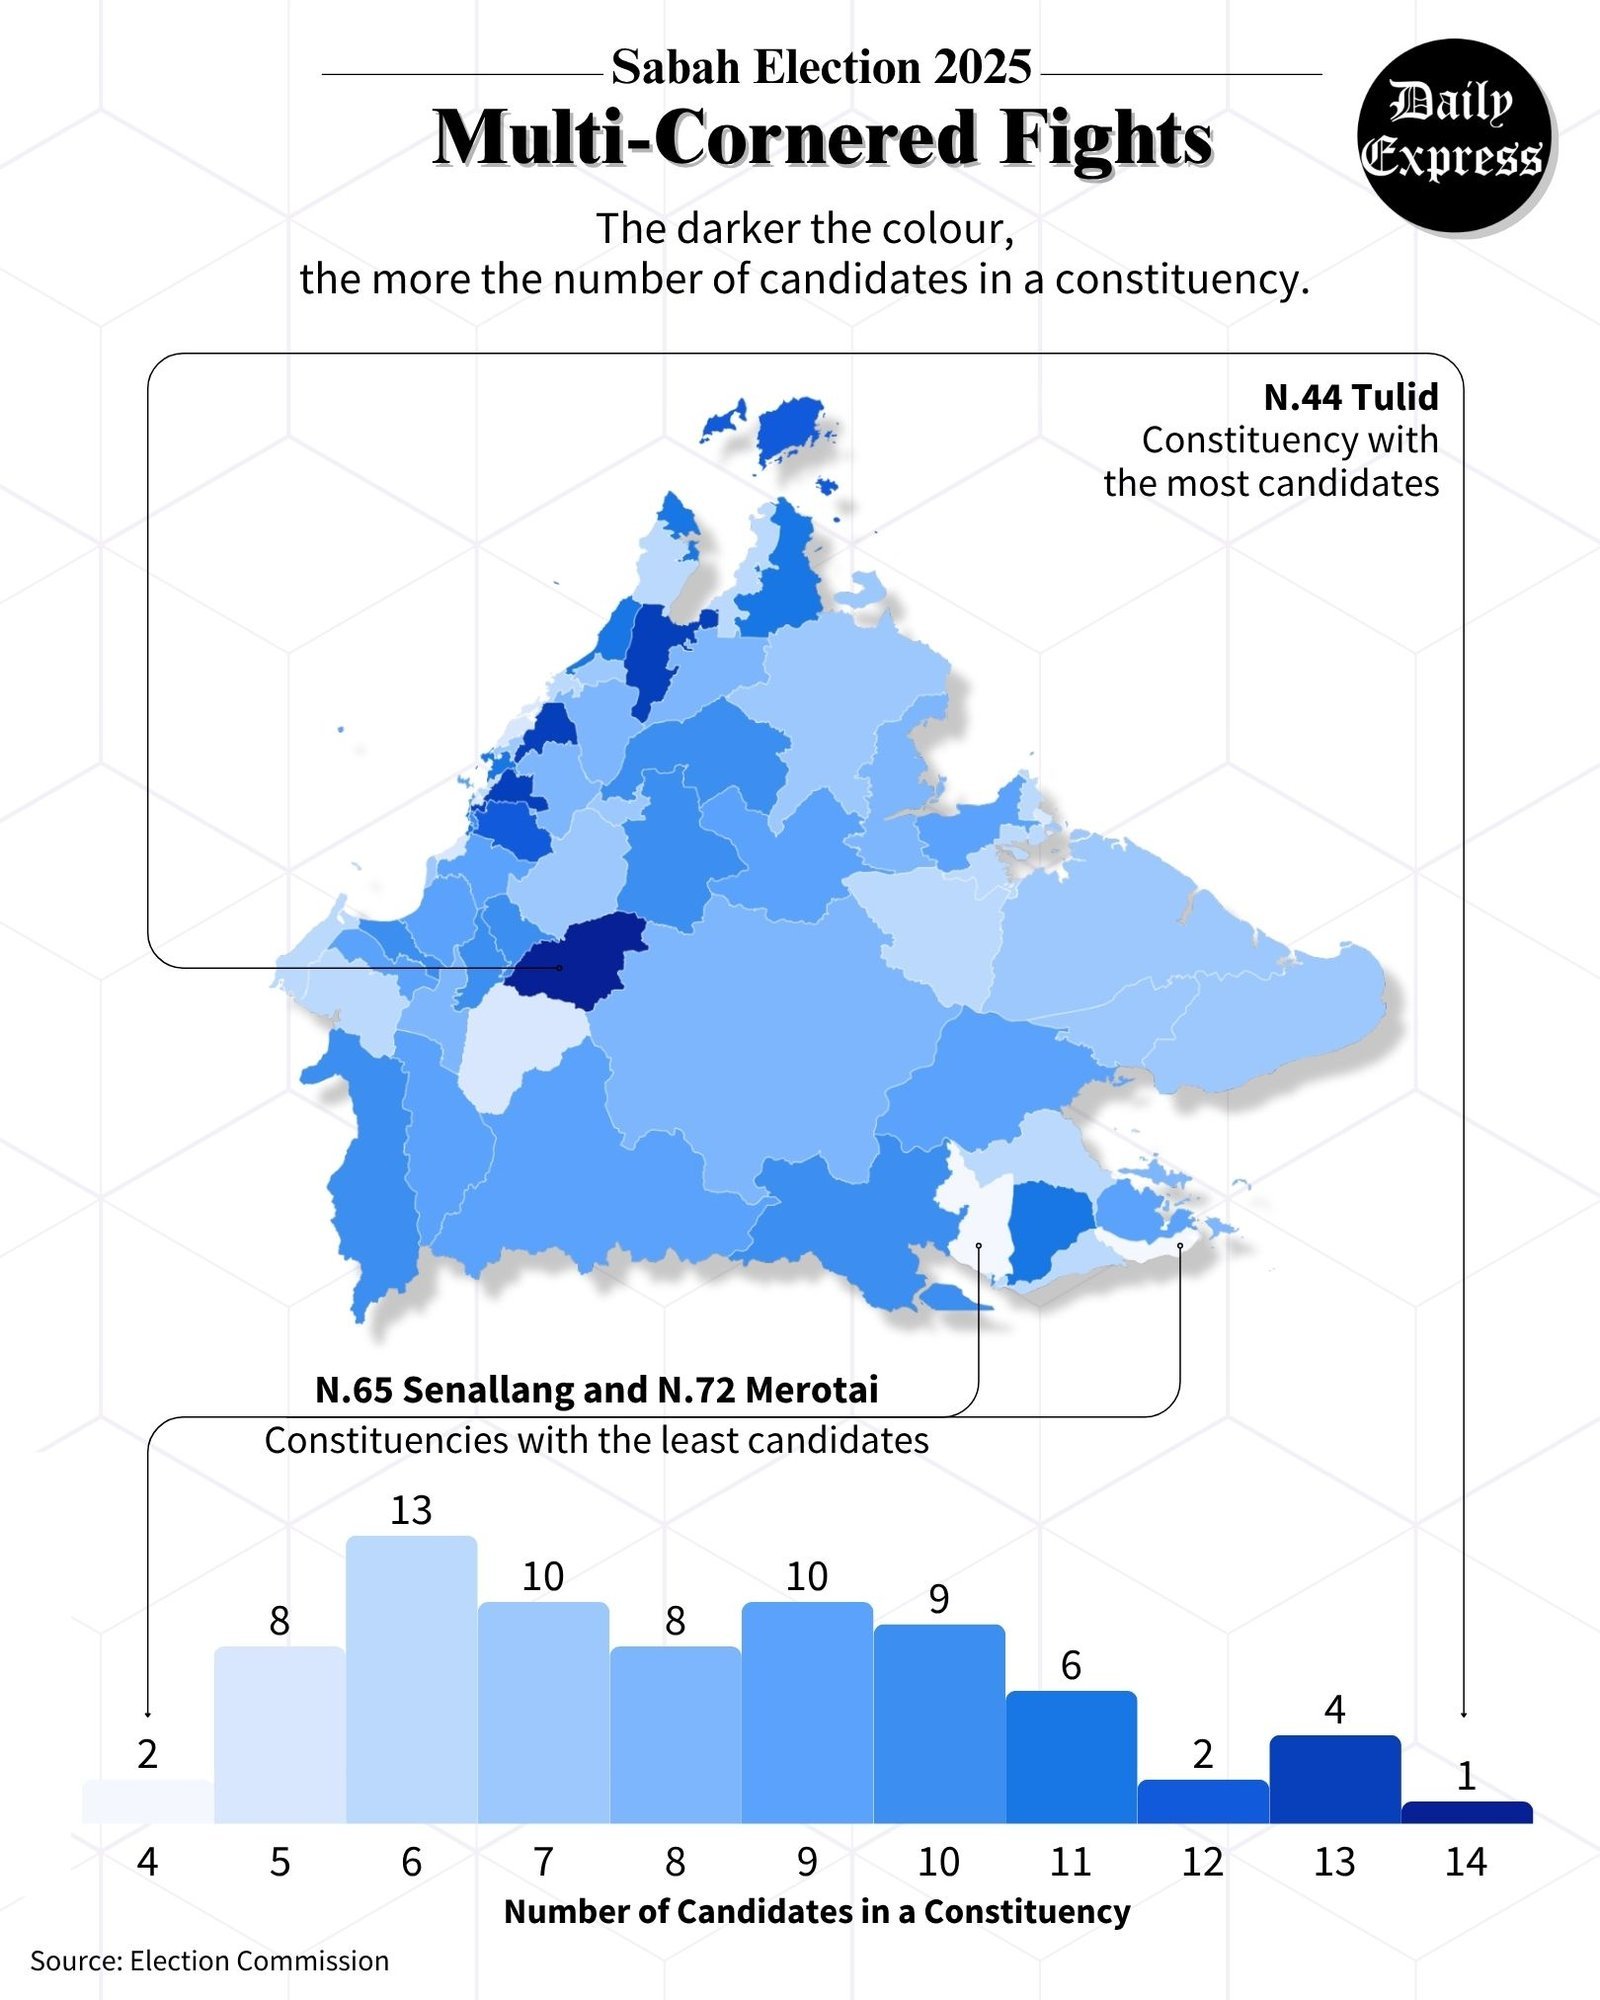
Malaysia's state elections generate enormous amounts of data — candidate filings, constituency breakdowns, vote counts, swing analysis — across a compressed and high-pressure timeline.

Newsgraphy designed and produced a complete suite of data-driven infographics for both Daily Express Malaysia (English) and Overseas Chinese Daily News (Chinese), tracking the full Sabah Election 2025 cycle from nomination day through to final results.

Each graphic was produced in both languages independently — not translated, but editorially localised — ensuring accuracy and clarity for each paper's distinct readership.

2 Languages produced simultaneously
2 Partner publications
02

FG Media (Malaysiakini) · Ministry of Finance · Ministry of Higher Education

Interactive Microsites
for Federal Ministries

Interactive microsites Government data viz Public storytelling

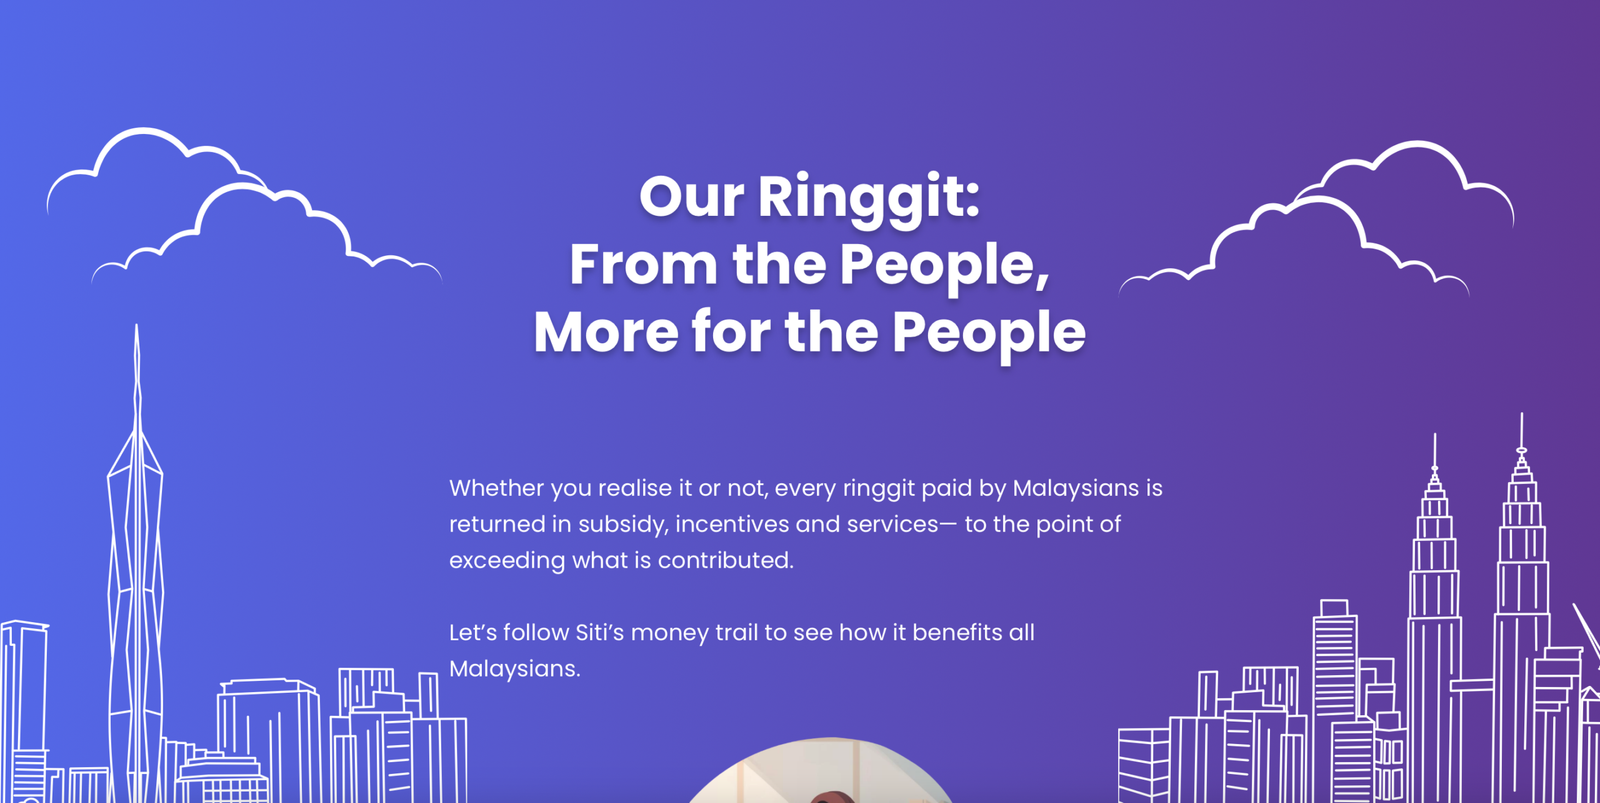
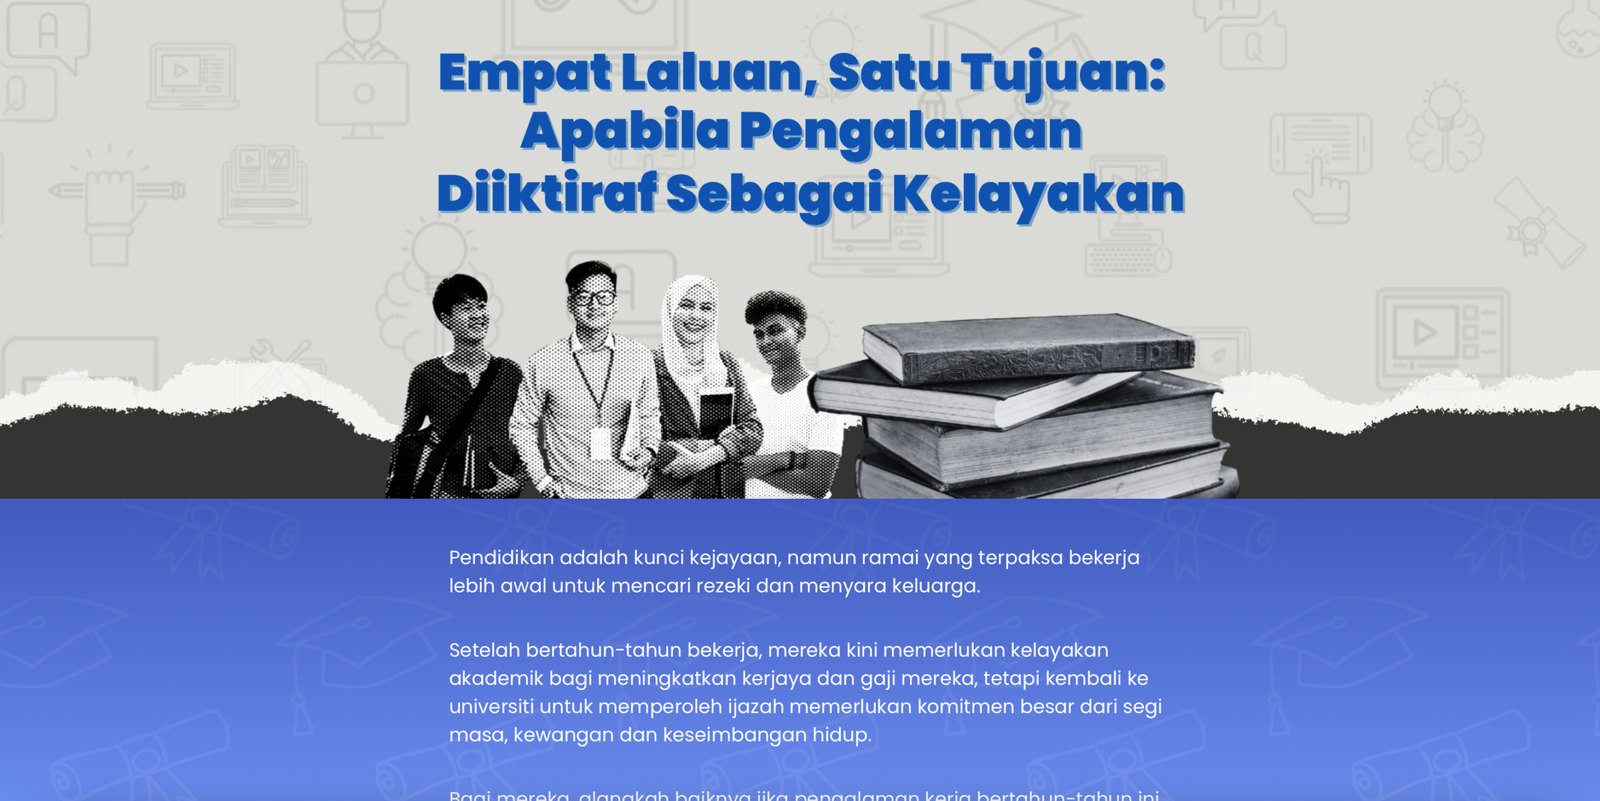
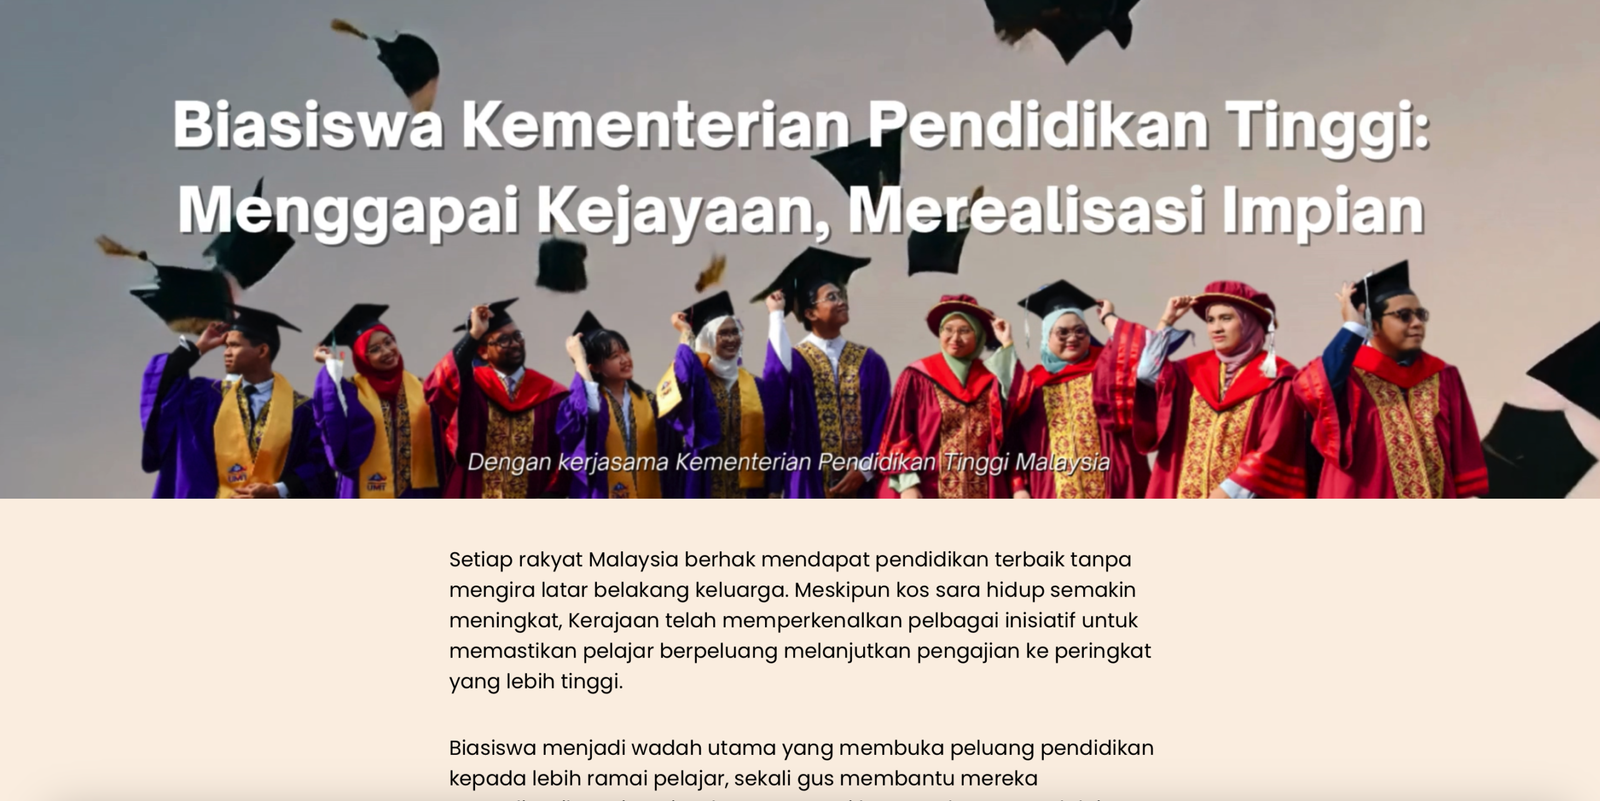
Government data is often accurate but rarely accessible. Policy documents, budget breakdowns, and education statistics exist — but most Malaysians never engage with them because the format demands too much effort to decode.

Newsgraphy partnered with FG Media Sdn. Bhd. to build interactive microsites commissioned by the Ministry of Finance and the Ministry of Higher Education — transforming official data and policy information into digital experiences the public could actually navigate, understand, and act on.

Each microsite was designed around a clear public narrative, with scroll-driven storytelling, data visualisations, and editorial framing that made complex policy information genuinely readable.

3 Interactive microsites delivered
2 Federal ministries served
03

Media Organisations & Higher Education Institutions, Malaysia

Data Storytelling
Workshops

Custom curriculum Hands-on training Team capacity-building

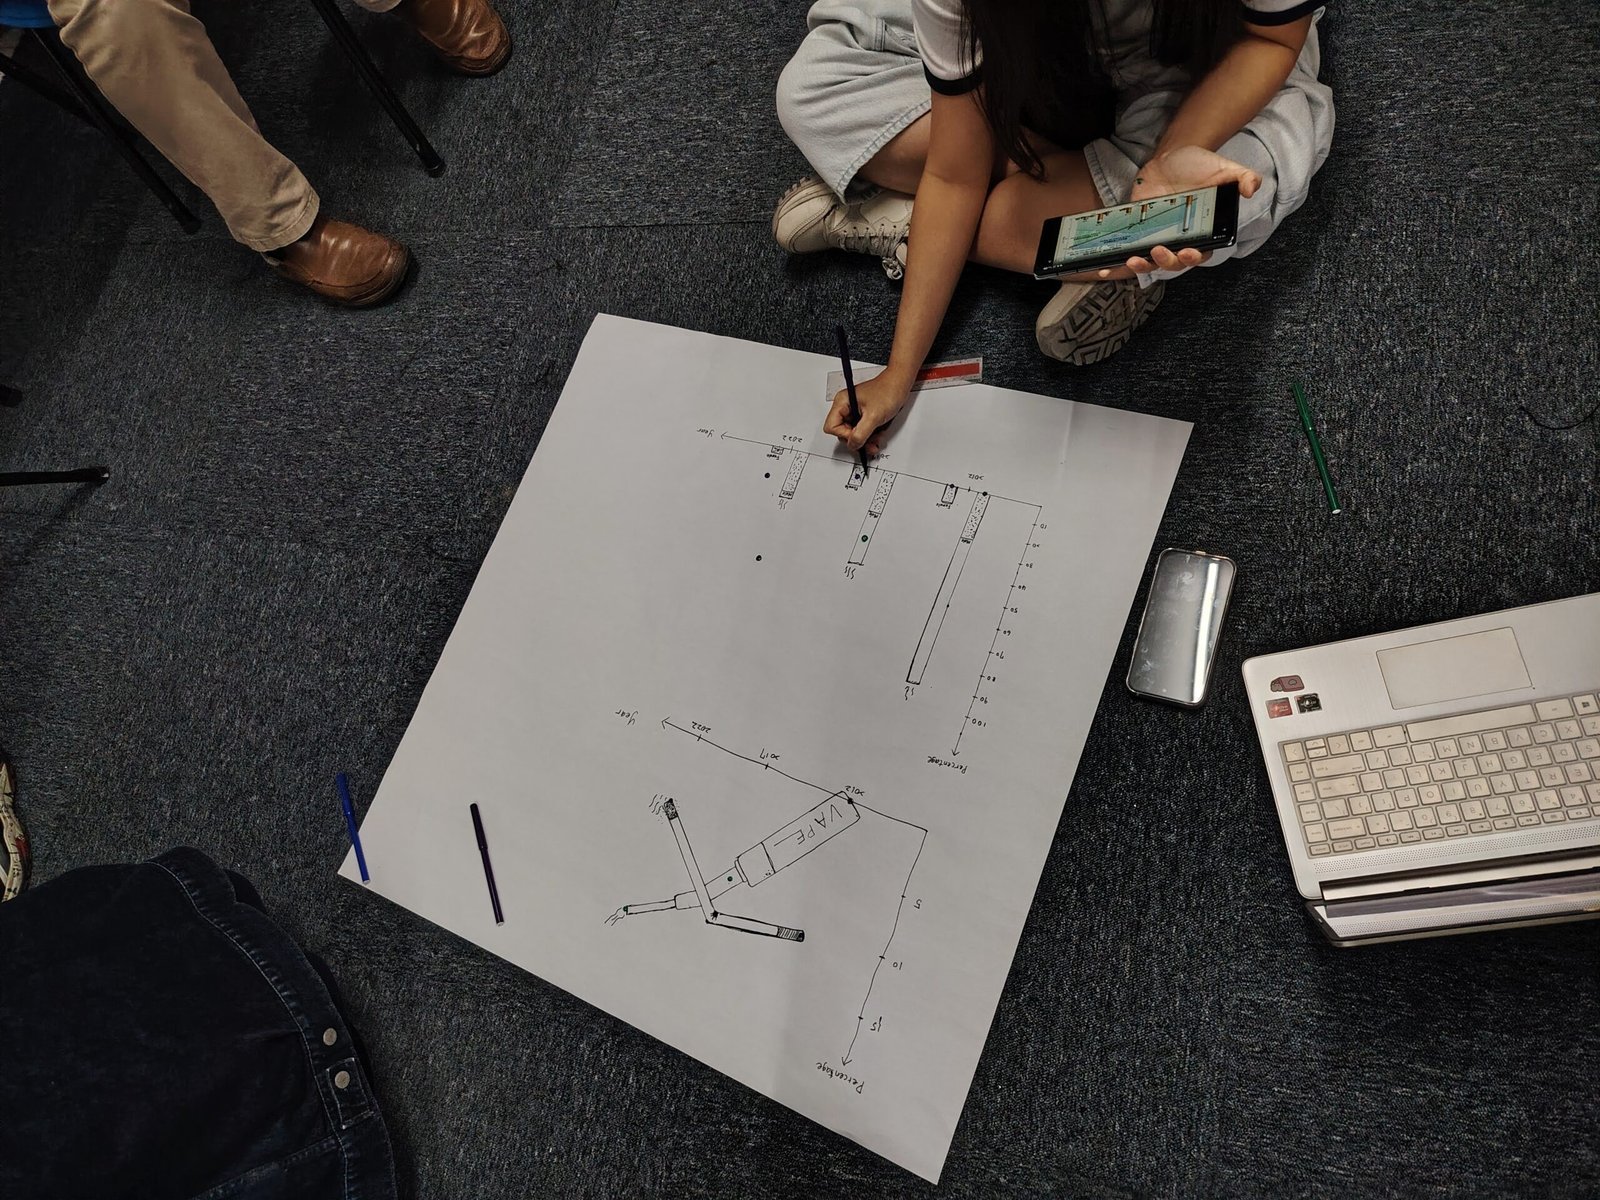
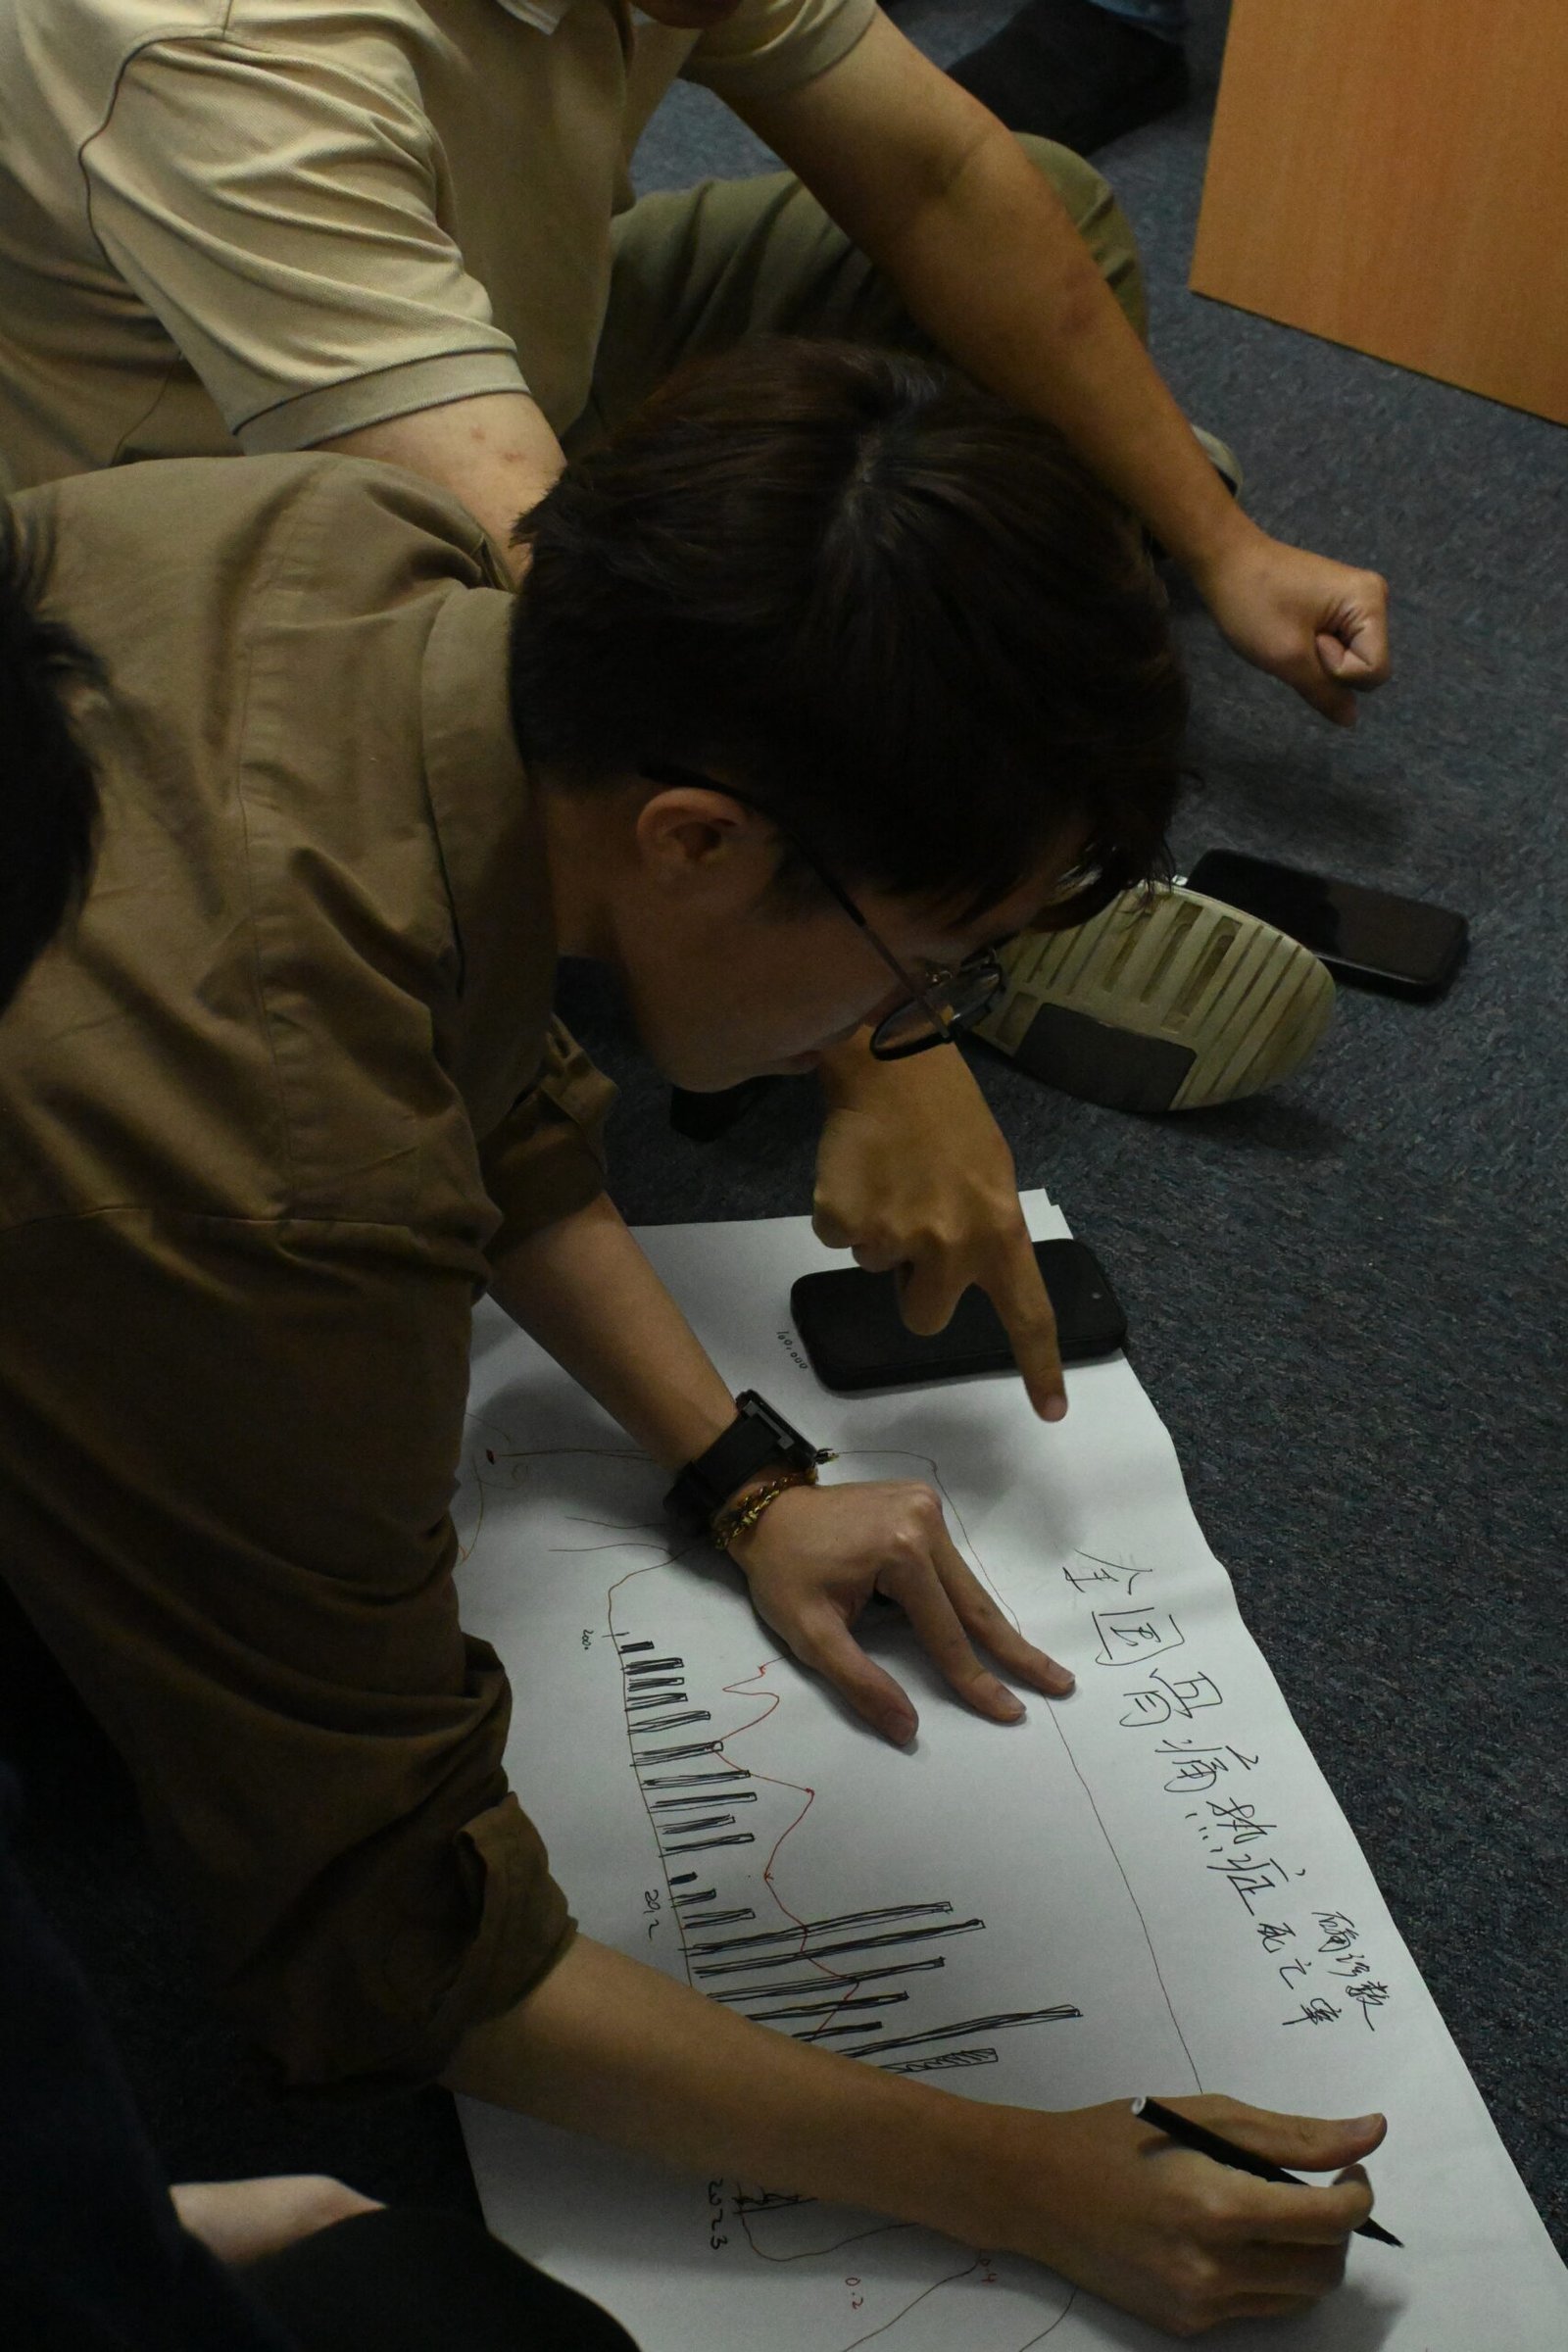
Many organisations sit on valuable data but lack the internal capacity to communicate it clearly. The gap is rarely the data itself — it is the skills to interpret it, frame it, and present it to an audience.

Newsgraphy designed and facilitated hands-on data storytelling workshops for media organisations and universities across Malaysia. Using real tools, live data exercises, and practical frameworks, participants left equipped to find, read, and communicate data independently.

Each workshop was customised to the organisation's domain and team — not a generic syllabus, but a programme built around the data challenges they actually face day to day.

100% Hands-on exercises with real data

From consultation to completion

01

Initial Consultation

We discuss your data, your audience, and the specific outcome you need. No commitment required at this stage.

02

Data & Scope Review

We assess your data sources, propose a narrative framework, and agree on deliverables, timeline, and methodology.

03

Design & Build

Our team designs, analyses, and produces — keeping you informed at each stage. Drafts are reviewed against your brief before finalisation.

04

Delivery & Support

Final files are delivered with source attribution, methodology notes, and any technical handover required for publication.

"We are a data storytelling studio
with an editorial backbone."

Every project we take on is governed by the same editorial standards that apply to our independent editorial work — verified data sources, methodological transparency, and a clear separation between creative execution and factual accuracy.

When you commission Newsgraphy, you are not just buying design. You are lending your audience our credibility — and we protect it on every brief. Our editorial standards are publicly available. We think that matters.

Read our editorial standards →

Common questions

How do we begin working together?

Send us an email at partnership@newsgraphy.my with a brief description of your project, your timeline, and your organisation. We will respond within two working days to arrange an initial consultation — no commitment required.

What does Newsgraphy need from us to get started?

Typically: your data or research materials, your communication objective, your target audience, and any brand guidelines. We handle everything from there — data interpretation, narrative framing, design, and delivery.

Can Newsgraphy work within our brand guidelines?

Yes. All client-facing work is adapted to your visual identity. Our editorial standards govern accuracy and methodology — your brand guidelines govern how it looks.

How long does a project take?

Timelines vary by scope and complexity. A single-page infographic typically takes up to ten working days, subject to project scope. An interactive microsite or full report visualisation project is scoped individually during the initial consultation.

Does Newsgraphy produce content in Chinese?

Yes — this is one of our core strengths. We produce editorial-grade content in both Chinese (Traditional and Simplified) and English from the same team. For organisations serving Malaysian Chinese-language audiences, this is a significant advantage over most data studios.

Does Newsgraphy work with organisations outside Malaysia?

We are based in Malaysia and our editorial work focuses on Malaysian data. For client projects, we are open to discussing regional engagements — reach out and we can advise based on your specific needs.

Ready to make your data understood?

Tell us about your project. We will tell you how we can help.

Book a free chat

No commitment. We'll see if there's a fit.

error: